Vercel Sandbox now exposes memory usage data in both the dashboard and CLI. The Memory Usage card reports average, P75, and P95 memory consumption alongside existing CPU and data transfer metrics, available at the sandbox, project, and team levels.
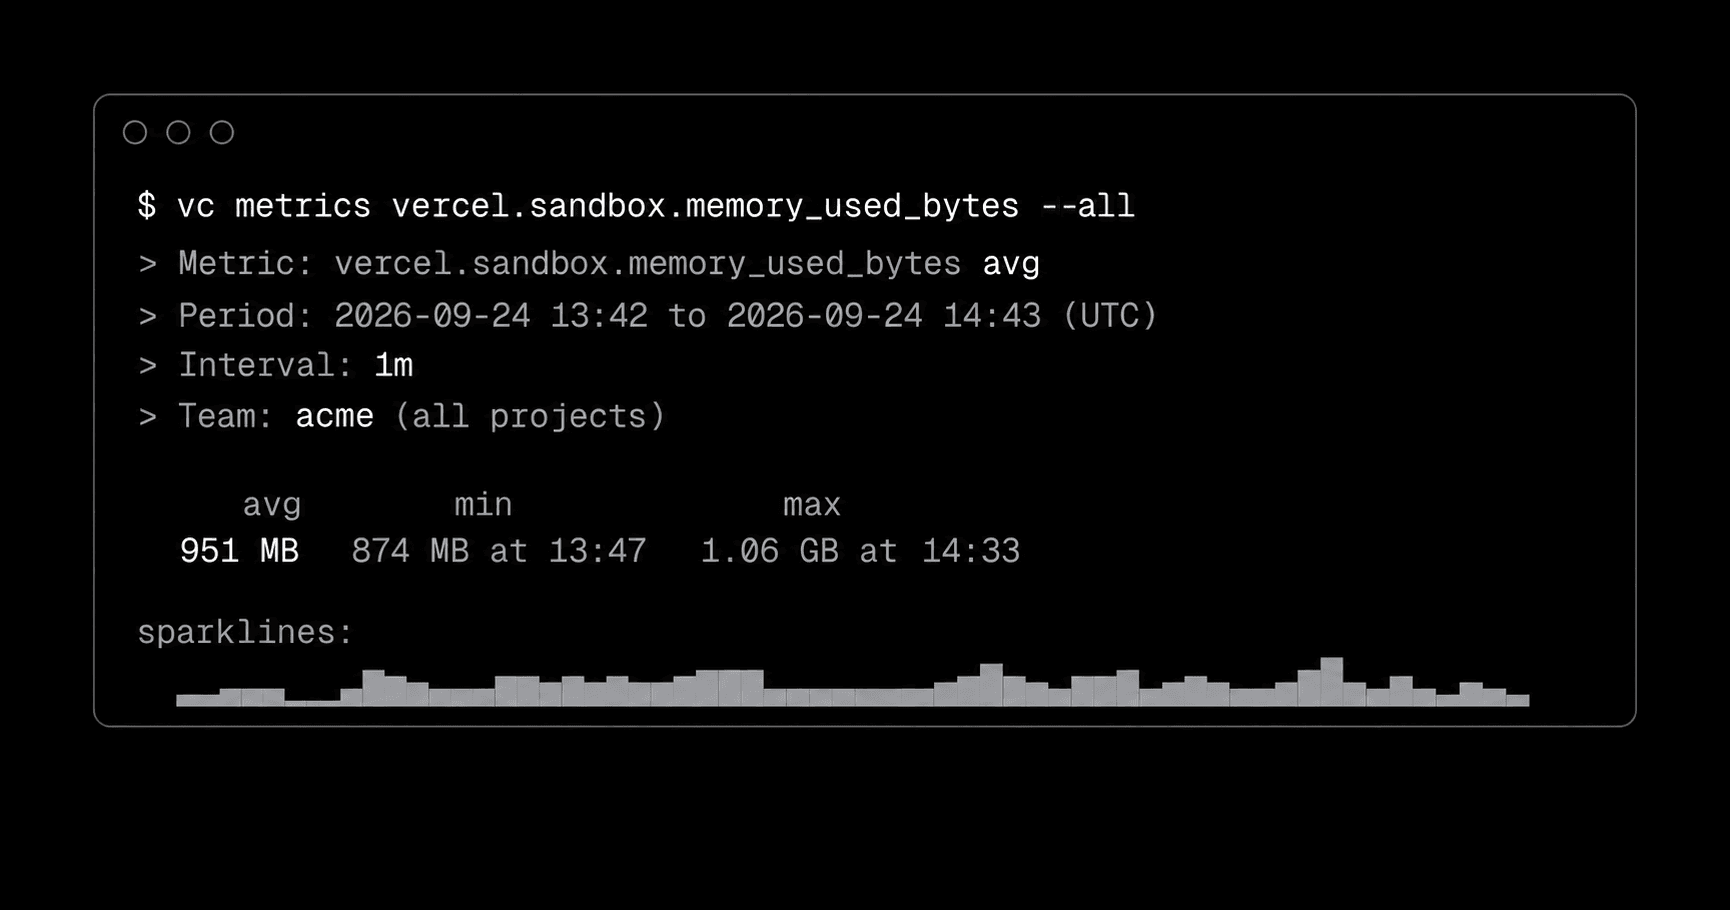
The detail page charts auto-scale to each sandbox's memory limit and draw a dashed reference line at 85% of that ceiling, giving operators a concrete warning threshold before resource exhaustion. The raw measure, memoryUsedBytes, is queryable in the Observability query builder, where you can build custom queries and wire up alerts directly from the chart. Via the CLI, running vercel metrics under vercel.sandbox.memory_used_bytes returns the metric, reporting period, measurement interval, associated project, and a min/max/avg graph. Append --all for team-wide aggregate data.
The 85% reference line design choice and the three-tier metric rollup are worth reading about in full. Teams running memory-intensive sandboxes now have a structured path from raw usage data to alerting without leaving the Vercel toolchain. Full details are in the Sandbox documentation.
[READ ORIGINAL →]